Andrea C.
This is part of a series of infographics related to climate change and sea level rise for my thesis research.

Sea Level Rise.
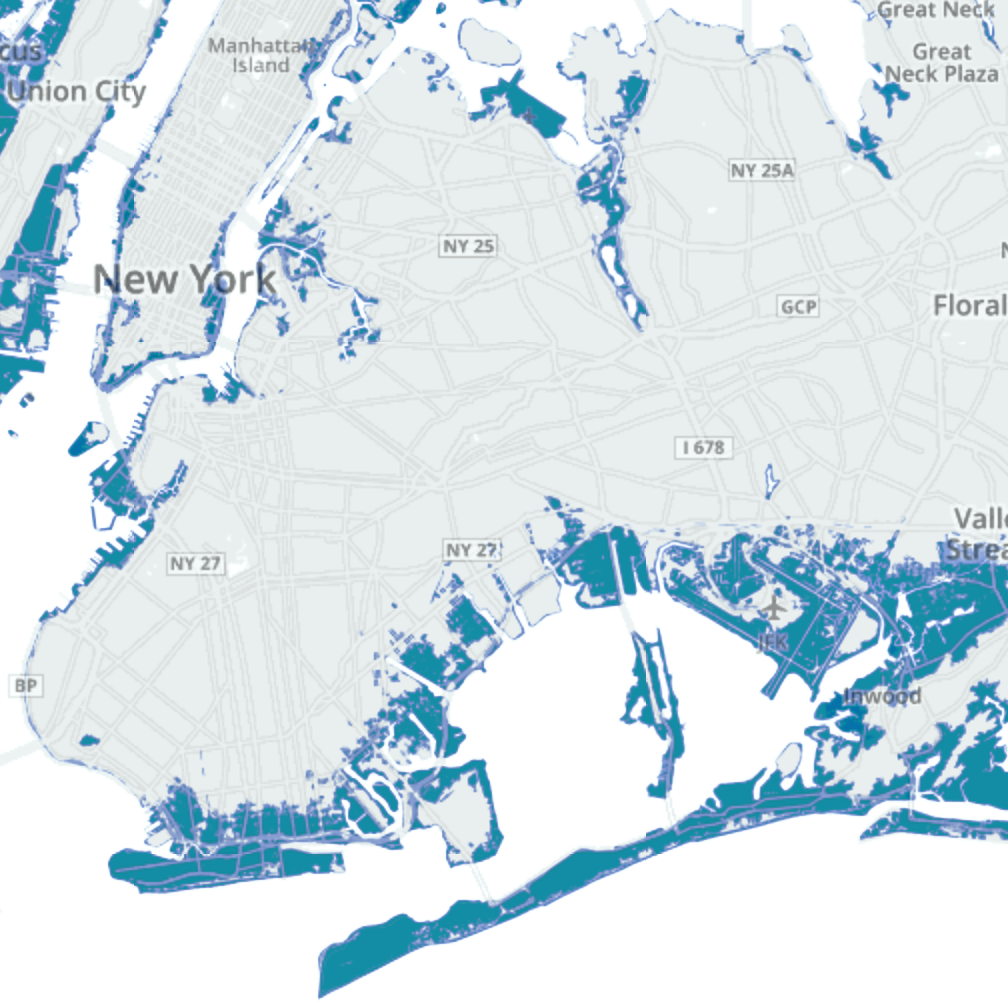
Many coastal areas in the United States are expected to be underwater in the next few decades, including New York’s Rockaway community. However, residents aren’t planning on leaving their flood prone neighborhoods despite worsening conditions due to sea level rise, which are then exacerbated by external effects, such as garbage clogged sewage systems.
How much does the temperature is rising?
It is a fact that the world is getting warmer. This is caused by humans and by a natural process of the earth. However, people is the most responsible of it and the ones who keep it increasing. According to NASA’s Goddard Institute for Space Studies (GISS), the average global temperature on Earth has increased by about 0.8° Celsius (1.4° Fahrenheit) since 1880. Two-thirds of the warming has occurred since 1975, at a rate of roughly 0.15-0.20°C per decade. So it is important to analyze locally what is happening, here is the analysis of three different areas in New York:
Rising Seas
Here you can visualize the most affected areas in New York and compare it to the temperature increase
JFK, QUEENS COUNTY
Variations of temperature during the year:
LA GUARDIA, QUEENS COUNTY
Variations of temperature during the year:
CENTRAL PARK
Variations of temperature during the year:
Thesis Project
Support or Contact
MFA in Desig for Social Innovation DSI